30 Day Map Challenge 2024 - Day 1: Points
This is day one of the 2024 #30daymapchallenge, a “Daily social mapping project happening every November.”
The theme of the first day is Points:
A map with points. Start the challenge with points. Show individual locations - anything from cities to trees or more abstract concepts. Simple, but a key part of the challenge.
Overall Topic
This year, I select an additional overall topic and therefore will focus on my home area: The city of Dresden, and the state of Saxony. I will try to base all my work on this or at least try to find some connection to those areas.
Data
Dresden provides an open data platform, which I only heard of, so far. Therefore, I will take the chance and explore the different datasets provided at the Dresden OpenDataPortal during the course of this challenge.
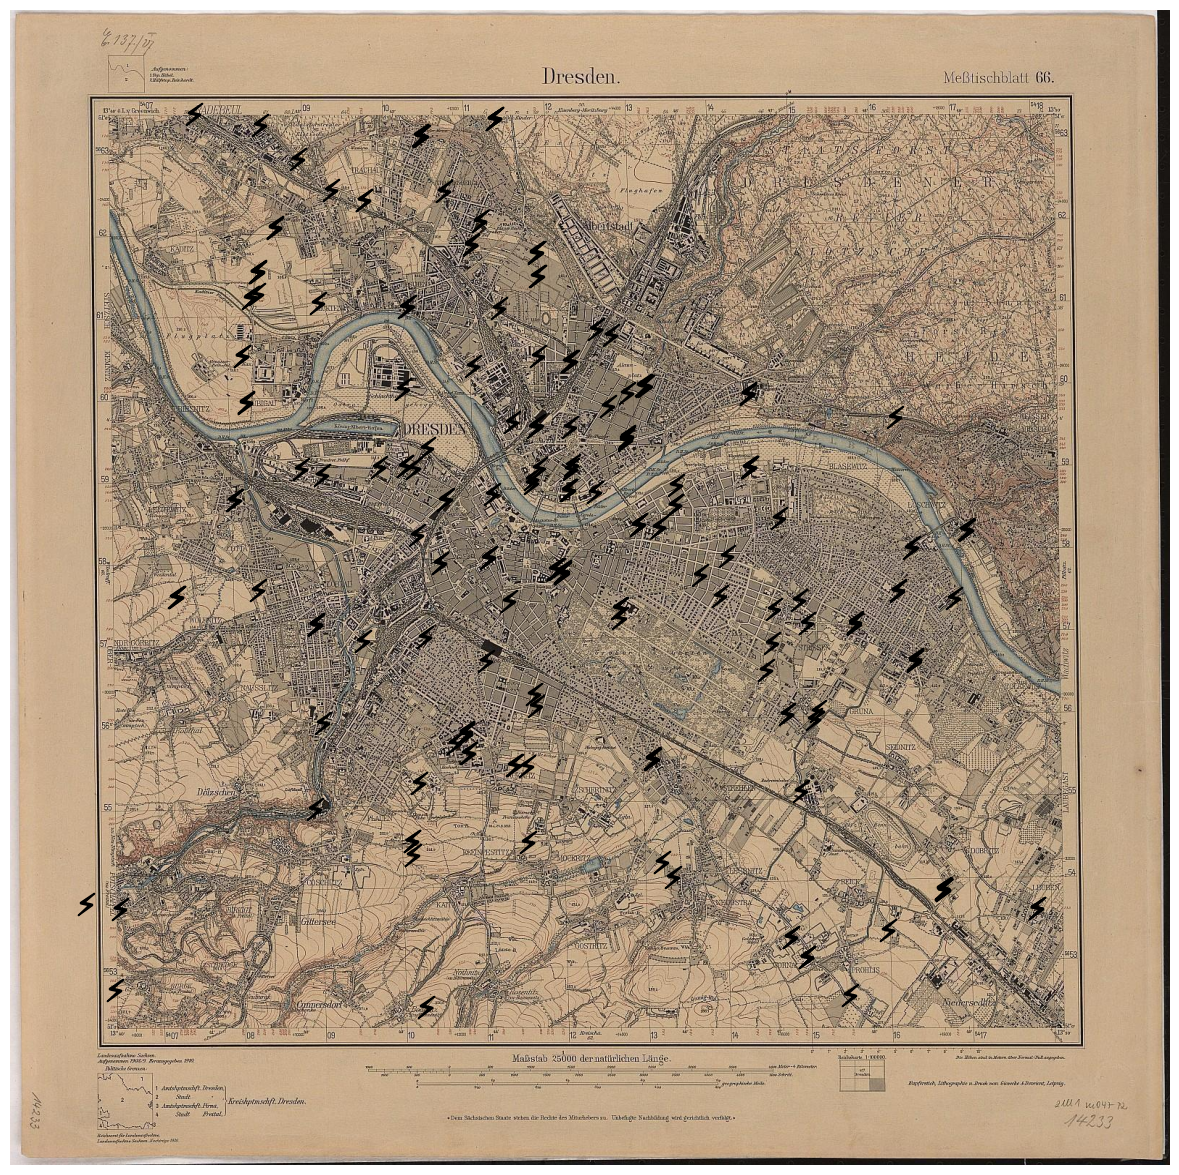
For today, I selected a simple example, which I think is very suitable for a mapping theme: The locations of all so-called Nagelsche Säulen in Saxony. Those stone pillars are named after Christian August Nagel, a professor for geodesy, who led the surveying of the Kingdom of Saxony between 1862 bis 1890.
Implementation
To create the maps for this year’s challenge, I will resort to doing it programmatically using Python and some specific mapping and visualisation libraries.
In my day-to-day job, I use pandas regularly for data handling, but I have little to no experience with mapping libraries. I found that there are a lot of options available, all having specific advantages and disadvantages. After going through a few review articles that give some ideas of the differences and individualities, I decided to give folium a try. This library allows to create appealing, interactive maps.
Now, let’s get started with creating the first map for this year’s #30daymapchallenge.
First, we need to import some libraries:
1
2
3
4
5
from pathlib import Path

import folium
import geopandas as gpd
import pandas as pd
Now, the data has to be loaded from the CSV file that I alread downloaded.
1
2
data_path = Path("data/dresden/nagelsche_saeulen.csv")
df = pd.read_csv(data_path, delimiter=";", header=0)
The data contains a column "geom" that holds each pillar’s coordinates in Well Known Text format.
Specifically, the format is an extended version of WKT that additionally contains the spatial reference system identifier (SRID).
For our data, it indicates that coordinates are given with respect to the WGS 84 reference coordinate system.
However, this information has to be stripped to transform the column into classic WKT format.
Afterwards, we can transfrom the pandas DataFrame into a GeoDataFrame, as follows:
1
2
3
4
5
6
7
8
9
gdf = gpd.GeoDataFrame(
    df.assign(
        geometry=lambda df: gpd.GeoSeries.from_wkt(
            df["geom"].str.removeprefix("SRID=4326;")
        )
    ),
    geometry="geometry",
    crs="EPSG:4326",
)
Now that the data is prepared, we can start visualising it and build the actual map. As stated initially, I will get in touch with folium for the first time now.
First, we need to create a map object. In my opinion, the default OpenStreetMap tiles are very busy and cluttered with loads of details. I like the CartoDB tiles with Positron style, which are much cleaner.
Plotting the data using folium is straightforward when it has been transformed into a GeoDataFrame, as shown above.
I also added a popup, which contains the name of the pillar when a marker on the map is selected.
Finally, the map is fitted so that it shows all the locations, we added.
1
2
3
4
5
6
7
8
map = folium.Map(tiles="CartoDB positron")

folium.GeoJson(
    gdf,
    popup=folium.GeoJsonPopup(["name"]),
).add_to(map)
map.fit_bounds(map.get_bounds())
map